By Eric Van Enk on July 26, 2025.
 SOURCE: NATIONAL BANK FINANCIAL
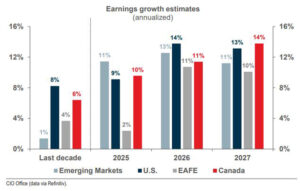
This week’s chart highlights earnings growth estimates for publicly traded companies in Canada (red), the U.S. (blue), Emerging Markets (light blue) and Europe, Australia & the Far East (grey).
In the first column on the left, the average annual earnings growth is displayed for each market over the last decade. Notice Canada is second only to the U.S. at 6 per cent vs. 8 per cent. Also notice that analysts expect Canadian publicly traded companies to realize superior earnings growth relative to the U.S. both this year and in 2027 (red bar above blue bar).
The importance of this chart lies in the fact that earnings growth ultimately drives stock prices. Short-term movements in share prices can be caused by numerous factors.
However, in the long term, earnings play a critical role in moving share prices higher or lower….

